I'm a Data Analyst at STARS Advanced Radiology Services, where I build R Shiny dashboards, automate reporting pipelines, and use SQL to drive insights that have led to a 60% reduction in unread worklists and an 85% reduction in aged A/R. I hold a BS in Economics with a Minor in Quantitative Data Analytics from Michigan State University.
Before my current role, I spent three summers as a Data Science Intern at Byrne Electrical Specialists, building IoT data pipelines, OEE dashboards, and statistical process control models for manufacturing equipment.
Outside of work, I channel my passion for data science into sports analytics projects — building Elo rating systems, Monte Carlo tournament simulations, and computer vision pipelines. My goal is to transition into machine learning and AI engineering, and the projects below reflect that trajectory.
A comprehensive analytics platform for VCT (Valorant Champions Tour) professional esports. Features a custom map-specific Elo rating system where each team maintains separate ratings across all competitive maps, enabling nuanced matchup analysis.
Includes match win probability predictions, Monte Carlo tournament simulations (Swiss, GSL, double elimination formats), interactive Elo history charts, player ratings, pick/ban analysis, and a record book — all backed by a PostgreSQL database with automated data ingestion via web scraping.
Each team holds separate Elo ratings per map — the rankings page shows these side by side. The margin-of-victory factor uses logarithmic scaling so blowouts shift ratings more than close games. K-factor (74) and rating scale (1000) were optimized via grid search to maximize prediction accuracy.
Match Prediction — Combinatorial Probability
P(BO3 win) = p1p2 + p1(1-p2)p3 + (1-p1)p2p3
The predictions page calculates win probability by enumerating every possible map outcome. For BO3: 3 winning paths (2-0, 1-1-win). For BO5: all 10 paths to 3 wins. Each map’s individual win probability comes from the Elo ratings shown on the rankings page.
TypeScriptlib/predictions/map-selection.ts
// Optimal map selection: each team bans their worst map// then picks their best from the remaining poolconst team1Ban = Object.values(team1Probabilities)
.filter(p => remainingMaps.has(p.map))
.sort((a, b) => a.probability - b.probability)[0]?.map;
// After bans, teams pick maps where they have// the highest win probability (game theory optimal)const team1Pick = Object.values(team1Probabilities)
.filter(p => remainingMaps.has(p.map))
.sort((a, b) => b.probability - a.probability)[0]?.map;
Drag-and-Drop Map Pool Comparison
Compare up to 4 teams’ map performance pools side by side using dnd-kit drag-and-drop. Each chart visualizes a team’s Elo ratings across all competitive maps, revealing strengths, weaknesses, and map pool depth at a glance. Useful for identifying which teams have the broadest or most specialized map pools.
Elo Trajectory Visualization
Track how team ratings evolve over time with interactive Recharts line charts. The data pipeline transforms flat rating history into chronological team series with interpolated step points for accurate rendering. Supports filtering by individual maps and seasons to isolate performance trends on specific battlegrounds.
Monte Carlo Tournament Simulation
Simulates entire VCT tournaments using Elo-based match probabilities. Supports multiple tournament formats — Swiss, GSL groups, and double elimination brackets. Each simulation runs thousands of iterations, producing probabilistic advancement and championship odds for every team. Historical tournaments can be re-simulated using the Elo snapshot from that point in time.
Valorant Plus/Minus (VPM) Player Model
Individual player ratings using a VPM (Valorant Plus/Minus) model that isolates each player’s contribution to team performance. Combines server-side rendered statistics with interactive graph visualizations to track player rating trajectories across tournaments and seasons.
Statistical Record Aggregation
Aggregates competitive records across the entire database: peak team ratings per map, longest win/loss streaks, perfect games, peak player performances, and map popularity trends. Uses 8+ parallel API requests and a carousel display system to present records in a browsable format spanning multiple VCT seasons.
Pick/Ban Efficiency Analysis
Analyzes each team’s veto phase decisions by comparing actual picks and bans to the Elo-optimal selection. A dual-chart system visualizes cumulative Elo advantage and win probability deltas at each veto step, revealing whether teams are making strategically sound decisions or leaving rating points on the table.
World Cup 2026 Draw Simulator
Live
Next.jsTypeScriptReactRechartsReact Simple Maps
An interactive FIFA World Cup 2026 draw simulator that accurately models the official tournament draw procedures with all FIFA constraints — confederation limits, host placement rules, and side-pairing requirements (e.g., Spain/Argentina must be on opposite bracket sides).
Uses recursive backtracking with constraint propagation to validate every placement in real-time. Includes 1 million pre-computed Monte Carlo simulations using bitmask-optimized constraint checking for instant probability lookups — group probabilities, opponent matchups, and stadium assignments.
Constraint Satisfaction via Recursive Backtracking
The simulator enforces all FIFA rules in real-time: max 2 UEFA teams per group, max 1 from any other confederation, and side-pairing constraints (Spain/Argentina and France/England must land on opposite bracket sides). When you drag a team, the engine runs a chained backtracking validation across Pots 2→3→4 to verify the remaining teams can still complete a valid draw.
TypeScriptlib/engine/fast-sim.ts
// Bitmask-encoded confederations for O(1) constraint checks// in the Monte Carlo simulation loop (1M iterations)const CONF_BITS = {
AFC: 1, CAF: 2, CONCACAF: 4,
CONMEBOL: 8, OFC: 16, UEFA: 32
};
// Greedy placement with bitmask validationfunctioncanPlace(groupMask: number, teamConf: number): boolean {
if (teamConf === CONF_BITS.UEFA) {
return uefaCount[group] <2;
}
return (groupMask & teamConf) ===0;
}
Monte Carlo Statistics — 1 Million Simulated Draws
Click the “Monte Carlo Stats” tab inside the app above to explore pre-computed statistics from 1 million simulated draws. Three views are available: Group Probabilities (color-coded matrix of each team’s chance of landing in each group), Opponent Analysis (most likely opponents sorted by probability), and Stadium Forecast (venue likelihood based on group placement). The simulation uses Int32Array typed arrays and bitmask encoding to run all 1M iterations in ~200ms.
An NCAA basketball tournament analysis platform that integrates four major ranking systems (NET, KenPom, EvanMiya, Torvik) for consensus team evaluation. Features interactive bracket building with click-to-advance winner selection, radar chart team comparisons across shooting, defense, and possession metrics, and travel logistics visualization using Leaflet maps with Haversine distance calculations.
Includes a dynamic rating normalization system that maps diverse metrics to a 0-100% color-coded scale (red → yellow → green), enabling fair visual comparison across different statistical domains.
The team sheets integrate 4 independent ranking systems (NET, KenPom, EvanMiya, Torvik) that use different scales. The normalization system dynamically computes min/max bounds across all teams, then maps every metric to a 0–100% scale. Defense metrics are direction-inverted (lower is better → higher normalized score). The resulting percentages drive color-coded gauges from red (0%) through yellow (50%) to green (100%).
Radar Chart Comparison — Counterpart Mode
The compare page offers two radar modes: like-for-like (same metrics overlaid) and counterpart (Team A’s offense vs. Team B’s defense). In counterpart mode, mirrored axis pairs (e.g., 2FG% vs. 2FG%D, FTRate vs. FTRateD) reveal how each team’s strengths match up against the other’s weaknesses. All 16+ metrics are normalized to the same 0–100 scale so the radar shape is meaningful, not distorted by differing units.
Interactive Bracket with Cascading State Engine
Click any matchup to select a winner and advance them through the 68-game tournament bracket. The winner selection engine uses a dependency graph where each game references its nextGameId and nextSlot. When you change a winner, the engine automatically propagates via syncWinnerToNext(), then runs clearInvalidWinnersDownstream() to recursively cascade validity checks — ensuring that changing a second-round pick correctly invalidates any dependent Sweet 16, Elite 8, or Final Four selections. A comparison overlay modal pops up for data-driven decision support.
Cooper Visualization — Historical Basketball Elo
Live
Next.jsTypeScriptRechartsTailwind CSS
An interactive dashboard for exploring 75+ years of college basketball Elo ratings (20,000+ data points from the Cooper dataset, 1949–2026). Features a multi-team comparison view with draggable time-range selection on charts, enabling users to rank teams by average Elo within any custom window of seasons.
Includes a paginated, sortable data table with team search, dual-axis line charts (Elo + Net Rating trends), and a rankings page with 3D flip-card reveals showing the top 25 teams for any selected era. Team colors and logos are dynamically applied throughout.
The Team Explorer renders multi-team Elo trend lines on a Recharts line chart, then overlays a draggable reference area. Clicking the chart activates the nearest handle (left or right boundary); dragging constrains handles so they can’t cross. The side panel computes average Elo within the selected window and ranks all selected teams, letting you answer questions like “Who was the best program of the 1990s?” Team logos appear at each team’s peak Elo point on the chart.
TypeScriptlib/cooper-data.ts
// Compute average Elo for selected teams within a season rangeexport functiongetSeasonAverages(
rows: CooperRow[],
startYear: number,
endYear: number
): Map<string, { avgElo: number; seasons: number }> {
const filtered = rows.filter(
r => r.season >= startYear && r.season <= endYear
);
const grouped = groupBy(filtered, r => r.sb_name);
return newMap(
[...grouped].map(([team, data]) => [
team,
{
avgElo: data.reduce((s, r) => s + r.b_xelo_n, 0) / data.length,
seasons: data.length
}
])
);
}
3D Flip-Card Rankings with Dual Range Slider
The rankings page uses a dual-thumb range slider to select a start and end season, then computes average Elo for every team within that window. The top 25 are displayed as CSS 3D flip cards (perspective + rotateY transform) — the front shows rank, logo, and Elo; hovering reveals the back with the team name, total Elo sum, and season count. Cards are color-coded with each team’s primary color for instant visual recognition.
PGA Golf Course Analysis — Clustering & Player Fit
Live
PythonStreamlitscikit-learnPandasPlotlySciPyData Golf API
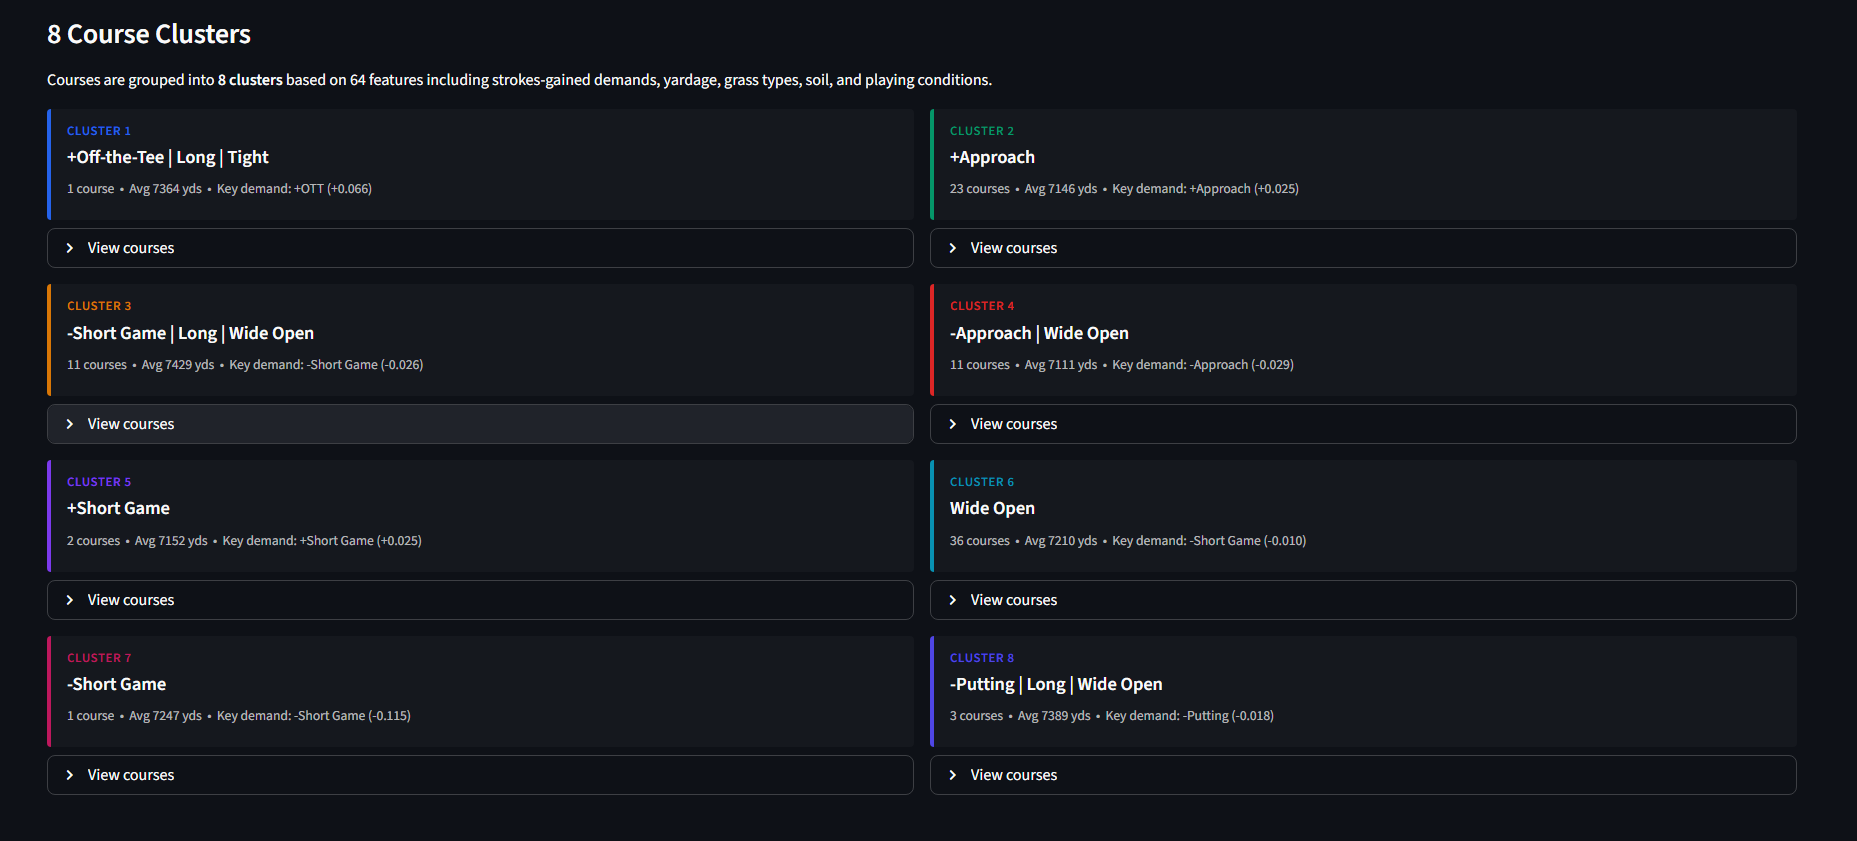
An interactive data science app that clusters 88 PGA Tour courses across a 64-dimensional feature space (strokes-gained demands, grass types, yardage, fairway profiles) using K-Means with silhouette-optimized cluster selection.
Matches ~435 active PGA players to course cluster types via a dot-product fit score that aligns player skill vectors with cluster demand profiles — predicting which players gain or lose strokes at each course archetype. Includes KNN course similarity search, hierarchical cluster dendrograms, and PCA variance analysis.
Each course is represented as a 64-dimensional vector (29 performance metrics + one-hot encoded grass/soil types), standardized via z-score scaling. K-Means runs k=2…15 with 300 initializations per k to avoid local optima. The silhouette score s(i) measures how well each course fits its assigned cluster: a(i) is the mean intra-cluster distance, b(i) is the nearest-cluster distance. The k that maximizes the average silhouette score is selected automatically.
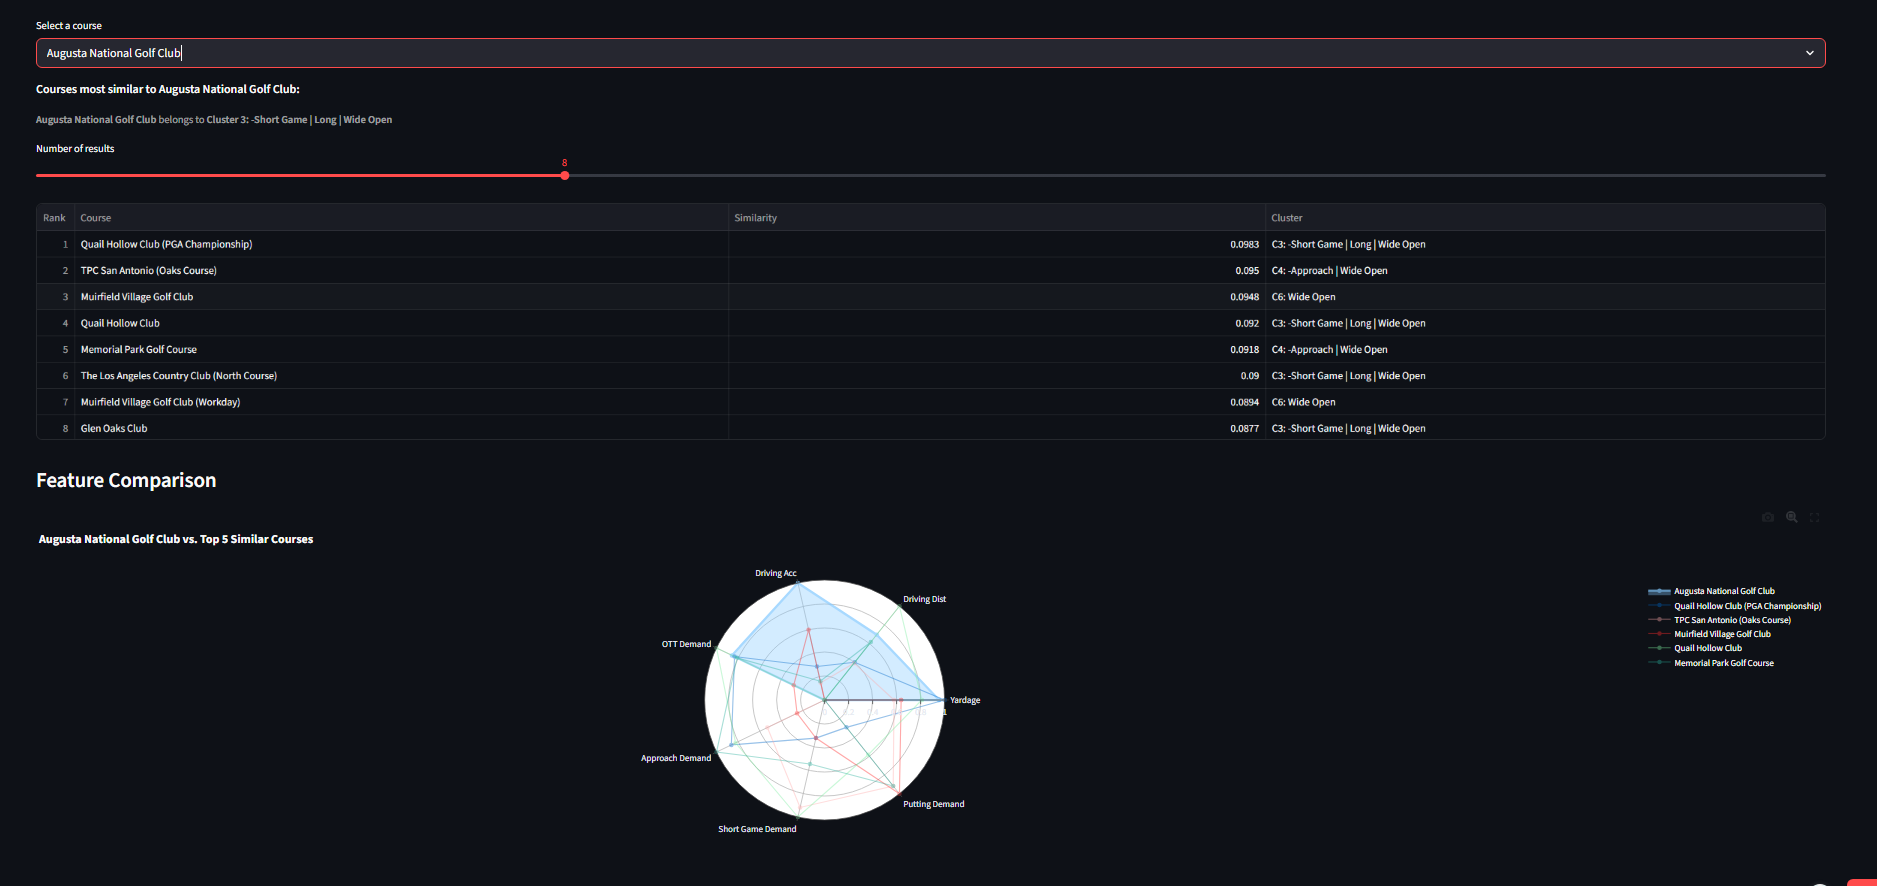
d(A, B) = √(∑j=164 (aj − bj)2) • similarity = 1 / (1 + d)
Given a selected course, the app computes Euclidean distance to all 87 other courses in the scaled 64-D feature space. The similarity score maps distance to a 0–1 range (1 = identical). A radar chart overlays the selected course against its top 5 matches across 7 normalized features — yardage, driving distance, driving accuracy, and 4 strokes-gained demands — making it easy to see where courses align or diverge.
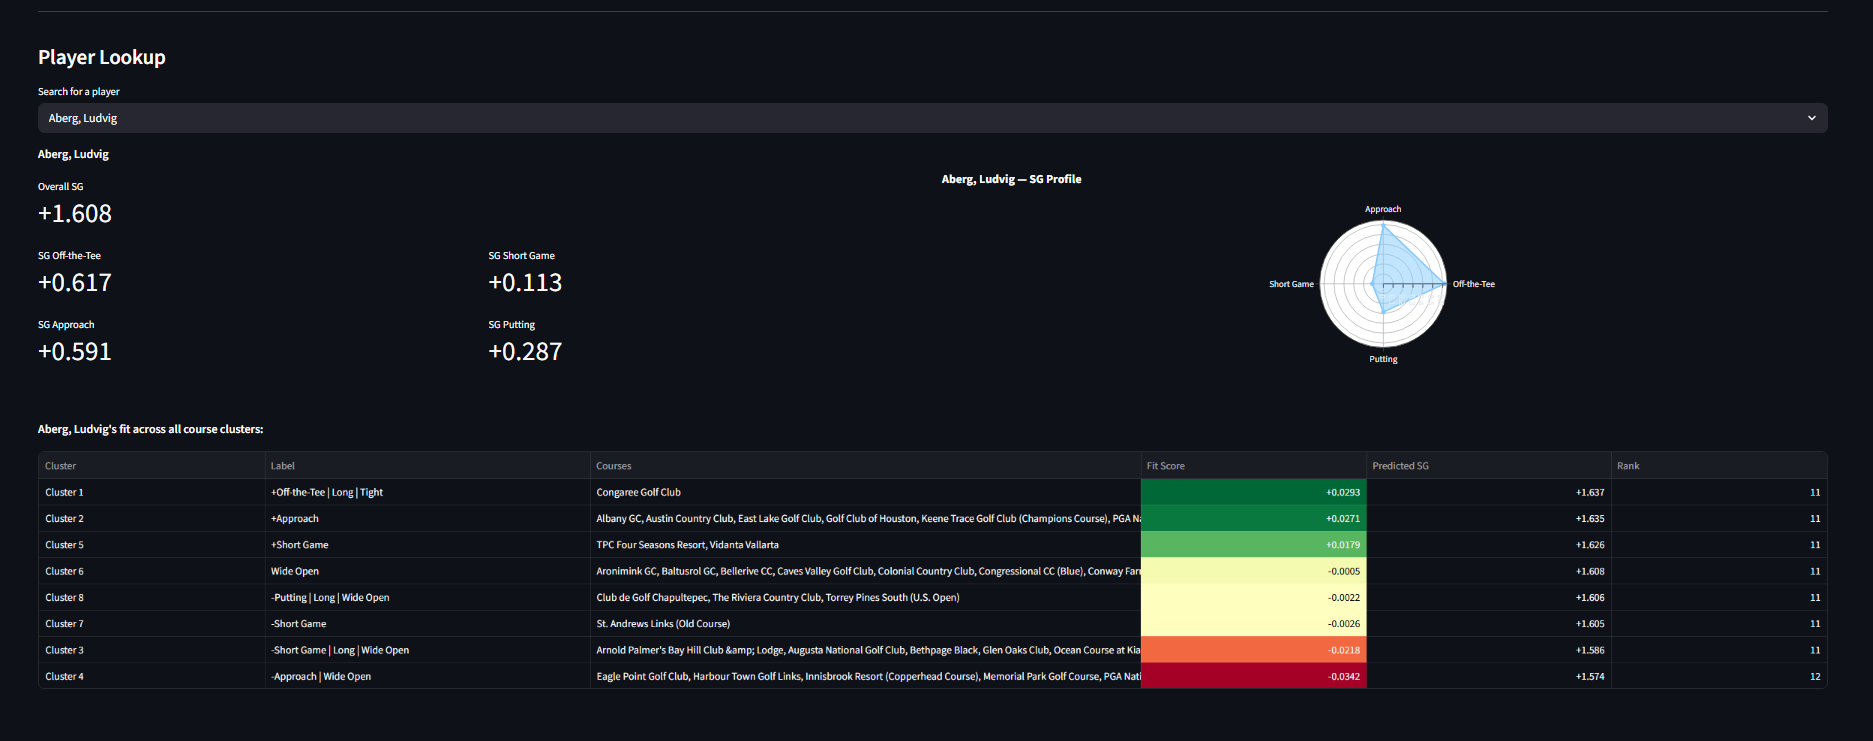
Player-Course Fit — Dot Product Scoring
Fit = ∑i (SGplayer,i × SGcluster,i) • Predicted SG = Baseline SG + Fit Score
Each player’s skill profile (OTT, Approach, Short Game, Putting) is treated as a 4-dimensional vector. Each cluster’s average SG demands form a second vector. The dot product measures alignment: positive when a player’s strengths match the cluster’s demands, negative when weaknesses are exposed. A strong putter gains strokes at putting-heavy clusters; a weak driver loses strokes at driving-heavy ones. Predicted SG = raw skill ± fit bonus.
Pythonsrc/player_performance.py
# Score every player against a cluster's SG demand profiledefcompute_fit_scores(players_df, cluster_profile):
sg_components = ['sg_ott', 'sg_app', 'sg_arg', 'sg_putt']
demand = ['ott_sg', 'app_sg', 'arg_sg', 'putt_sg']
fit = sum(
players_df[sc] * cluster_profile[d]
for sc, d inzip(sg_components, demand)
)
return players_df['sg_total'] + fit
PCA Variance Analysis — Dimensionality Diagnostic
Var explained = λk / ∑j λj
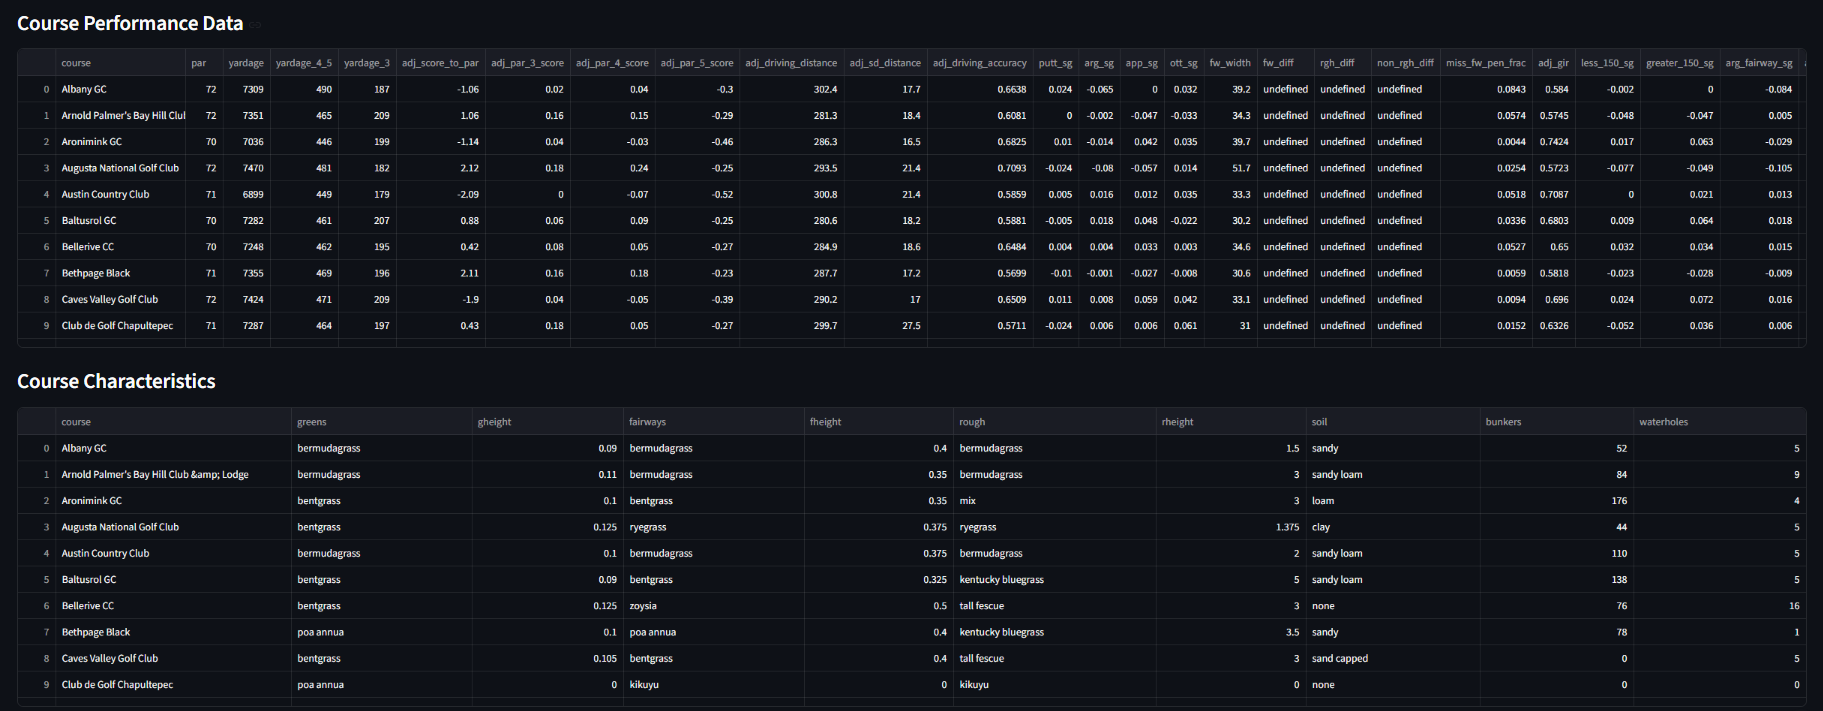
The Data Explorer tab exposes the raw datasets: 88 courses × 29 performance metrics, grass/soil characteristics, and ~435 player skill ratings. The PCA variance plot shows how information concentrates across principal components — despite 64 features, ~85% of variance is captured in roughly 20–25 components. Clustering deliberately uses the full 64-D space rather than a reduced representation, preserving the fine-grained signal from grass types and course layout features that PCA would compress.
HoopStats — AI Basketball Box Score
In Progress
PythonPyTorchOpenCVRoboflowSAM2PaddleOCR
A computer vision pipeline that processes basketball game video to automatically generate shot-by-shot statistics and player box scores. Uses Roboflow's RF-DETR model for multi-class detection (players, ball, rim, jersey numbers, shot types), with ByteTrack and Meta's SAM2 for player tracking across frames.
Includes homography transformation to map pixel coordinates to NBA court positions (in feet), enabling accurate shot location classification (2PT/3PT). Play recognition uses Dynamic Time Warping (DTW) with hierarchical clustering to identify similar offensive possessions from trajectory data.
A subsidiarity-first liquid democracy prototype exploring how different voting mechanisms affect collective decision-making. The core is a fully-tested Python voting package implementing 6 electoral methods: Plurality, Approval, Instant Runoff (IRV), Borda Count, Condorcet with Ranked Pairs (Tideman), and Quadratic Voting — with 144+ passing tests.
The web layer (Next.js + Supabase) provides proposal creation with structured intake forms, ballot management, and domain/program-based topic organization. Designed to eventually support topic-scoped delegation graphs and AI-assisted voting recommendations.
cost(v) = v2 credits net_score(candidate) = Σ vi where Σ vi2 ≤ budget
Voters allocate a fixed credit budget (default 100) across candidates. The quadratic cost function means casting 5 votes costs 25 credits but casting 10 votes costs 100, discouraging extreme positions and encouraging sincere preference revelation. Negative votes (opposition) are supported.
Pythonvoting/methods/condorcet.py
defranked_pairs(pairwise_matrix, candidates):
"""Tideman's Ranked Pairs: resolve Condorcet cycles
by locking victories in order of margin strength."""
victories = []
for i, j incombinations(candidates, 2):
margin = pairwise_matrix[i][j] - pairwise_matrix[j][i]
if margin >0:
victories.append((i, j, margin))
elif margin <0:
victories.append((j, i, abs(margin)))
# Sort by margin desc, then winning votes, then tiebreak
victories.sort(key=lambda v: v[2], reverse=True)
locked = defaultdict(set)
for winner, loser, _ in victories:
if notcreates_cycle(locked, winner, loser):
locked[winner].add(loser)
# Winner: candidate with no incoming edgesreturnfind_source(locked, candidates)
Contact
Interested in working together on ML, data science, or analytics projects? Let's connect.